


Industrial Oxygen Analysis and Selection Guide (3-Part Series):
1. Physical Foundations of Oxygen Analysis
Industrial oxygen analysis is not fundamentally about “measuring oxygen concentration,” but about accurately determining the oxygen partial pressure (ppO₂). Regardless of whether the method is electrochemical, zirconia, paramagnetic, TDLAS, gas‑phase fluorescence quenching, GC, or MS, all techniques measure the behavior of oxygen molecules within a specific physical field—behavior that is ultimately driven by oxygen partial pressure. Therefore, understanding ppO₂, VOL%, pressure compensation, and background‑gas effects is essential for building a reliable oxygen‑measurement system.
2. Oxygen Partial Pressure (ppO₂)
Oxygen partial pressure is the fundamental physical quantity in oxygen measurement and follows Dalton’s law of partial pressures:
ppO₂ = x(O₂) × P_total
Its engineering significance includes:
All sensor outputs are proportional or correlated to ppO₂: zirconia measures electromotive force, paramagnetic sensors measure magnetic force, electrochemical sensors measure current, TDLAS measures absorption intensity, and fluorescence quenching measures lifetime—all driven by oxygen partial pressure.
ppO₂ is a cross‑condition comparable quantity: changes in pressure, temperature, or humidity do not alter its physical meaning.
Safety interlocks (SIS) should be based on ppO₂ rather than VOL%: because interlock activation depends on the absolute oxidizing capability of oxygen.
Thus, ppO₂ is the first‑principle quantity in oxygen analysis.
2.1 Influence of Oxygen Partial Pressure on Measurement Error
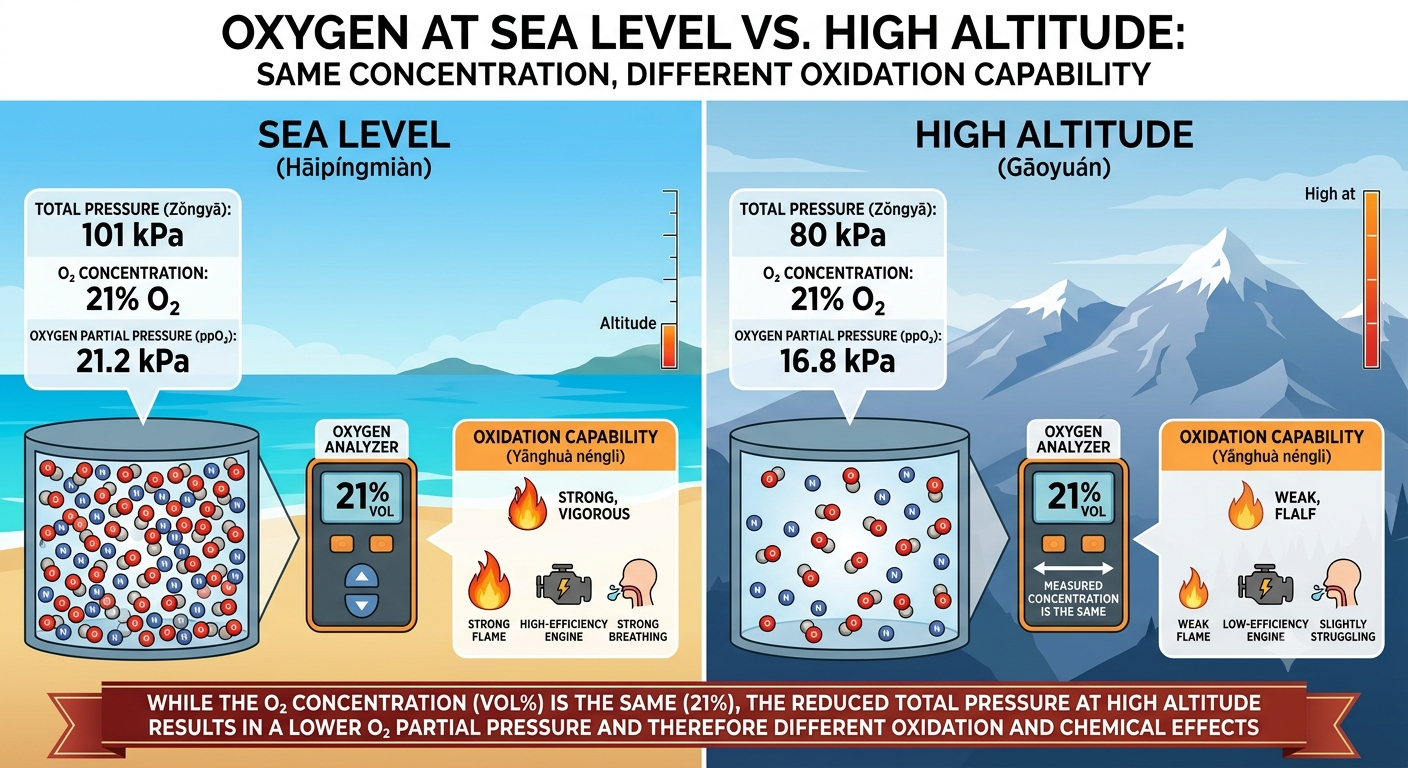
Pressure variation is the dominant source of systematic error in oxygen measurement. When oxygen concentration remains constant:
Total pressure increases → ppO₂ increases → reading drifts high
Total pressure decreases → ppO₂ decreases → reading drifts low
Quantitatively, under near‑atmospheric conditions (≈100 kPa), a 1 kPa change in pressure introduces approximately a 1% deviation in the measured value.
Typical scenarios include:
High‑altitude environments: atmospheric pressure decreases significantly; uncompensated instruments underestimate oxygen concentration.
Pressurized vessels: pressure fluctuations directly cause reading drift, potentially affecting safety decisions.
Temperature, humidity, contaminants: alter diffusion efficiency or block sampling paths, reducing effective ppO₂ and causing low readings or slower response.
2.2 Pressure Compensation Techniques
Because oxygen measurement is based on ppO₂, pressure variations cause errors when converting to volume fraction (VOL%). Different measurement architectures require different compensation strategies.
(1) In‑situ measurement
The sensor is directly exposed to process pressure; pressure fluctuations directly change ppO₂. If the output is VOL%, pressure compensation is mandatory. Most mid‑/low‑end in‑situ instruments rely on stable process pressure; only some high‑end models support external pressure sensors and compensation algorithms.
(2) Extractive measurement
After pressure regulation, sample gas is typically vented to atmosphere. Instrument internal pressure is therefore dominated by the vent side, requiring barometric compensation.
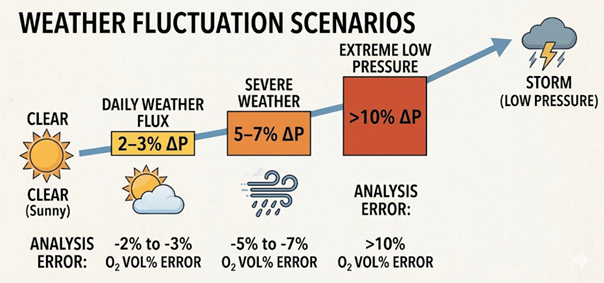
If the instrument lacks compensation, altitude and weather changes introduce significant errors:
1% change in atmospheric pressure → ~1% VOL% error
Daily weather variation: 2–3%
Severe weather: 5–7%
Extreme low pressure: >10%
Only some high‑end instruments include built‑in barometric sensors and automatic compensation, such as the SMART series oxygen analyzers from MZD Analytik GmbH.
(3) Pressure‑compensation strategy in enclosed spaces (ppO₂ vs VOL%)
In enclosed or semi‑enclosed spaces, the oxygen mole count remains constant; total pressure changes mainly due to temperature, agitation, or micro‑leakage.
ppO₂: directly reflects the absolute amount of oxygen; unaffected by total pressure changes.
VOL%: varies with total pressure but does not represent actual oxygen quantity; requires pressure or barometric compensation.
2.3 Selection of Oxygen‑Measurement Units
Oxygen measurement may output ppO₂, VOL%, or ppm. The choice depends on process requirements.
ppO₂: unaffected by total pressure; suitable for enclosed spaces, inerting, and safety interlocks.
VOL%: pressure‑dependent; suitable for open systems but requires pressure or barometric compensation.
3. Why Does Oxygen‑Analysis Selection Fail?
Seven Common Industry Misconceptions
Industrial oxygen analysis failures rarely originate from “poor analyzers,” but from insufficient understanding of operating conditions, incorrect unit selection, and missing system engineering. Across a large number of industry cases, over 80% of selection problems arise from incomplete definition of operating conditions, rather than from limitations of the analytical technology itself.
Misconception 1: Treating VOL% as an absolute quantity and ignoring ppO₂
Many users habitually regard volume fraction (VOL%) as the sole indicator of oxygen content. However, VOL% is inherently a relative unit and varies with total pressure. In the following scenarios, this misunderstanding leads to severe deviations:
High‑altitude / elevation changes
Atmospheric‑pressure fluctuations due to weather
Temperature or pressure changes in enclosed spaces
Unstable vent‑side pressure in extractive systems
Typical consequences include:
Incorrect inerting protection
SIS interlock setpoints shifting
Systematic underestimation or overestimation of oxygen content
Root cause: ignoring the first‑principle quantity of oxygen analysis — oxygen partial pressure (ppO₂).
Misconception 2: Focusing only on the analyzer and ignoring the complete measurement system
In industrial oxygen measurement, errors often do not originate from the analyzer itself, but from the system:
Dead volume causing response delay
Condensation reducing ppO₂
Micro‑leaks causing ppm‑level oxygen spikes
Flow fluctuations causing reading drift
Mismatched pretreatment causing long‑term drift
In trace‑oxygen (ppb–ppm) applications, system errors may exceed analyzer errors by 1–2 orders of magnitude.
Root cause: ignoring the fact that the measurement chain consists of analyzer + sampling system + pretreatment + pressure control.
Misconception 3: Ignoring pressure compensation (especially in extractive systems)
In extractive systems, the vent side is typically open to atmosphere. Therefore:
1% change in atmospheric pressure → ~1% VOL% error
Daily weather variation: 2–3%
Low‑pressure weather or typhoons: 5–10%
In SIS, inerting, or oxygen‑enriched systems, such deviations may lead to incorrect safety decisions.
Root cause: no pressure compensation or no monitoring of vent‑side atmospheric pressure.
Misconception 4: Misusing electrochemical analyzers in VOC / high‑humidity / corrosive environments
Electrochemical oxygen sensors experience drastically shortened lifetime in the presence of:
Organic‑solvent vapors (alcohols, ketones, esters, ethers, aromatics)
Acidic gases (HCl, HF, SO₂, NOₓ)
High humidity or condensation
Oil mist and particulates
Typical symptoms:
Zero‑point drift
Slower response
Increased noise
Lifetime reduced from 1–3 years to months or even weeks
Root cause: electrolyte dilution, electrode poisoning, membrane swelling, and changes in diffusion coefficients.
Misconception 5: Using dissolved‑oxygen (DO) analyzers as gas‑phase oxygen analyzers
Some users directly apply DO analyzers to gas‑phase measurement. However, DO sensors rely on:
Oxygen permeating through a polymer/gel
Oxygen dissolving and diffusing within the membrane
Response governed by membrane swelling, plasticization, and extraction effects
In gas‑phase applications, typical problems include:
Slow response
Increased drift
VOC‑induced membrane structural changes
Pressure‑dependent dissolution‑equilibrium shifts
Root cause: DO sensors are not designed as native gas‑phase measurement structures.
Misconception 6: Ignoring response time and SIL requirements
Many users focus only on “range” and “accuracy,” while ignoring the relationship between response time (T90) and Safety Integrity Level (SIL).
Typical mistakes:
Using instruments with T90 = 20–30 s for SIS
Using extractive systems in fast‑changing oxygen environments
Using slow‑response technologies for inerting protection
Possible consequences:
Delayed SIS activation
Inerting failure
Oxygen excursions not detected in time
Root cause: response time not incorporated into safety‑function design.
Misconception 7: Incomplete definition of operating conditions (the root cause of selection failure)
This is the most common and most critical mistake.
Typical missing information:
Temperature (whether >600°C)
Pressure (whether fluctuating or vacuum)
Humidity (whether condensation occurs)
Background gases (H₂, CO₂, VOC, corrosives)
Cleanliness (dust, oil mist, tar)
Response‑time requirements (SIS or not)
Installation method (in‑situ / extractive)
Maintenance capability (calibration, cleaning)
When operating conditions are not fully defined, no selection can be reliable.
Root cause: failure to adopt a “condition‑driven” selection workflow.
Oxygen‑analysis selection failures do not stem from “insufficiently advanced technology,” but from:
Incorrect understanding of measurement units
Incomplete definition of operating conditions
Missing system engineering
Mismatch between technical technology and actual conditions
Avoiding these seven misconceptions is the prerequisite for building a reliable oxygen‑measurement system and the foundation for subsequent technical‑technology selection.
4. Principles of Oxygen‑Measurement System Design
The accuracy of oxygen analysis depends not only on the analyzer itself, but on the quality of the entire measurement system. In most industrial scenarios, system errors are often far greater than analyzer errors, meaning that proper sampling design, gas‑path architecture, pressure control, and diagnostic capability are essential for long‑term measurement reliability.
4.1 Differences Between Extractive and In‑situ Systems
Extractive systems: Suitable for trace‑level and high‑accuracy applications; offer strong controllability but require high integrity in sealing, minimal dead volume, and proper pretreatment. Typical applications: trace oxygen, high‑precision analysis, complex background gases.
In‑situ systems: Fast response and simple structure; suitable for high‑temperature and process‑control applications, but require attention to contamination, condensation, and process interfaces. Typical applications: fast‑response control, safety interlocks.
There is no absolute superiority between the two. The correct choice depends on operating conditions, oxygen‑concentration range, response‑time requirements, and maintenance capability.
4.2 System Sensitivity in Trace‑Oxygen Measurement
Trace oxygen (ppb–ppm) is extremely sensitive to system design:
Even micro‑leaks can cause errors of several orders of magnitude
Material adsorption/desorption causes response tailing
Dead volume and flow fluctuations amplify system deviations
Therefore, trace‑oxygen measurement must use a system that is clean, well‑sealed, and low in dead volume.
4.3 Key Engineering Control Measures
To ensure measurement accuracy and long‑term stability, system design should follow five principles:
Pressure and flow must be stable. Pressure fluctuations are the main source of VOL% drift; flow fluctuations affect response time and representativeness.
The system must have high‑integrity sealing. Especially for trace oxygen, micro‑leaks cause order‑of‑magnitude errors.
Dead volume must be minimized. Larger dead volume → slower response → system “memory” of previous oxygen levels.
Contamination must be effectively isolated. Oil mist, condensation, organic solvents, and corrosive gases can cause sensor drift or failure.
The system must have basic diagnostic capability. Including flow monitoring, pressure monitoring, analyzer/sensor health status. These diagnostics help determine whether readings reflect true process conditions or system abnormalities.
4.4 Sources of System Error and Engineering Influencing Factors
In real industrial applications:
Analyzer intrinsic error: typically ±1% FS
System error: may reach ±5% to ±50% (or even orders of magnitude)
Typical system‑error sources include:
Micro‑leaks → high readings
Dead volume → delayed response
Pressure fluctuations → drift
Contamination → zero‑point drift
Sampling point not representative of actual process
In practice, system error is usually far greater than analyzer error, meaning that system‑design quality determines final measurement quality. Thus, system engineering is the decisive factor in oxygen‑analysis reliability, while the analyzer is only one part of the measurement chain.
Application Note: Industrial Oxygen Analysis Technologies and Application Selection Guide  , if you need more information, please contact us at sales@mzdd.de.
For product information, please visit:
Fluorescence quenching O2 analyzer